

optimizacion-conversion4 min read
Composable Commerce: eCommerce Guide
Composable commerce is a modular e-commerce architecture where you pick the best components for each function. Learn what it is, how it differs from the...
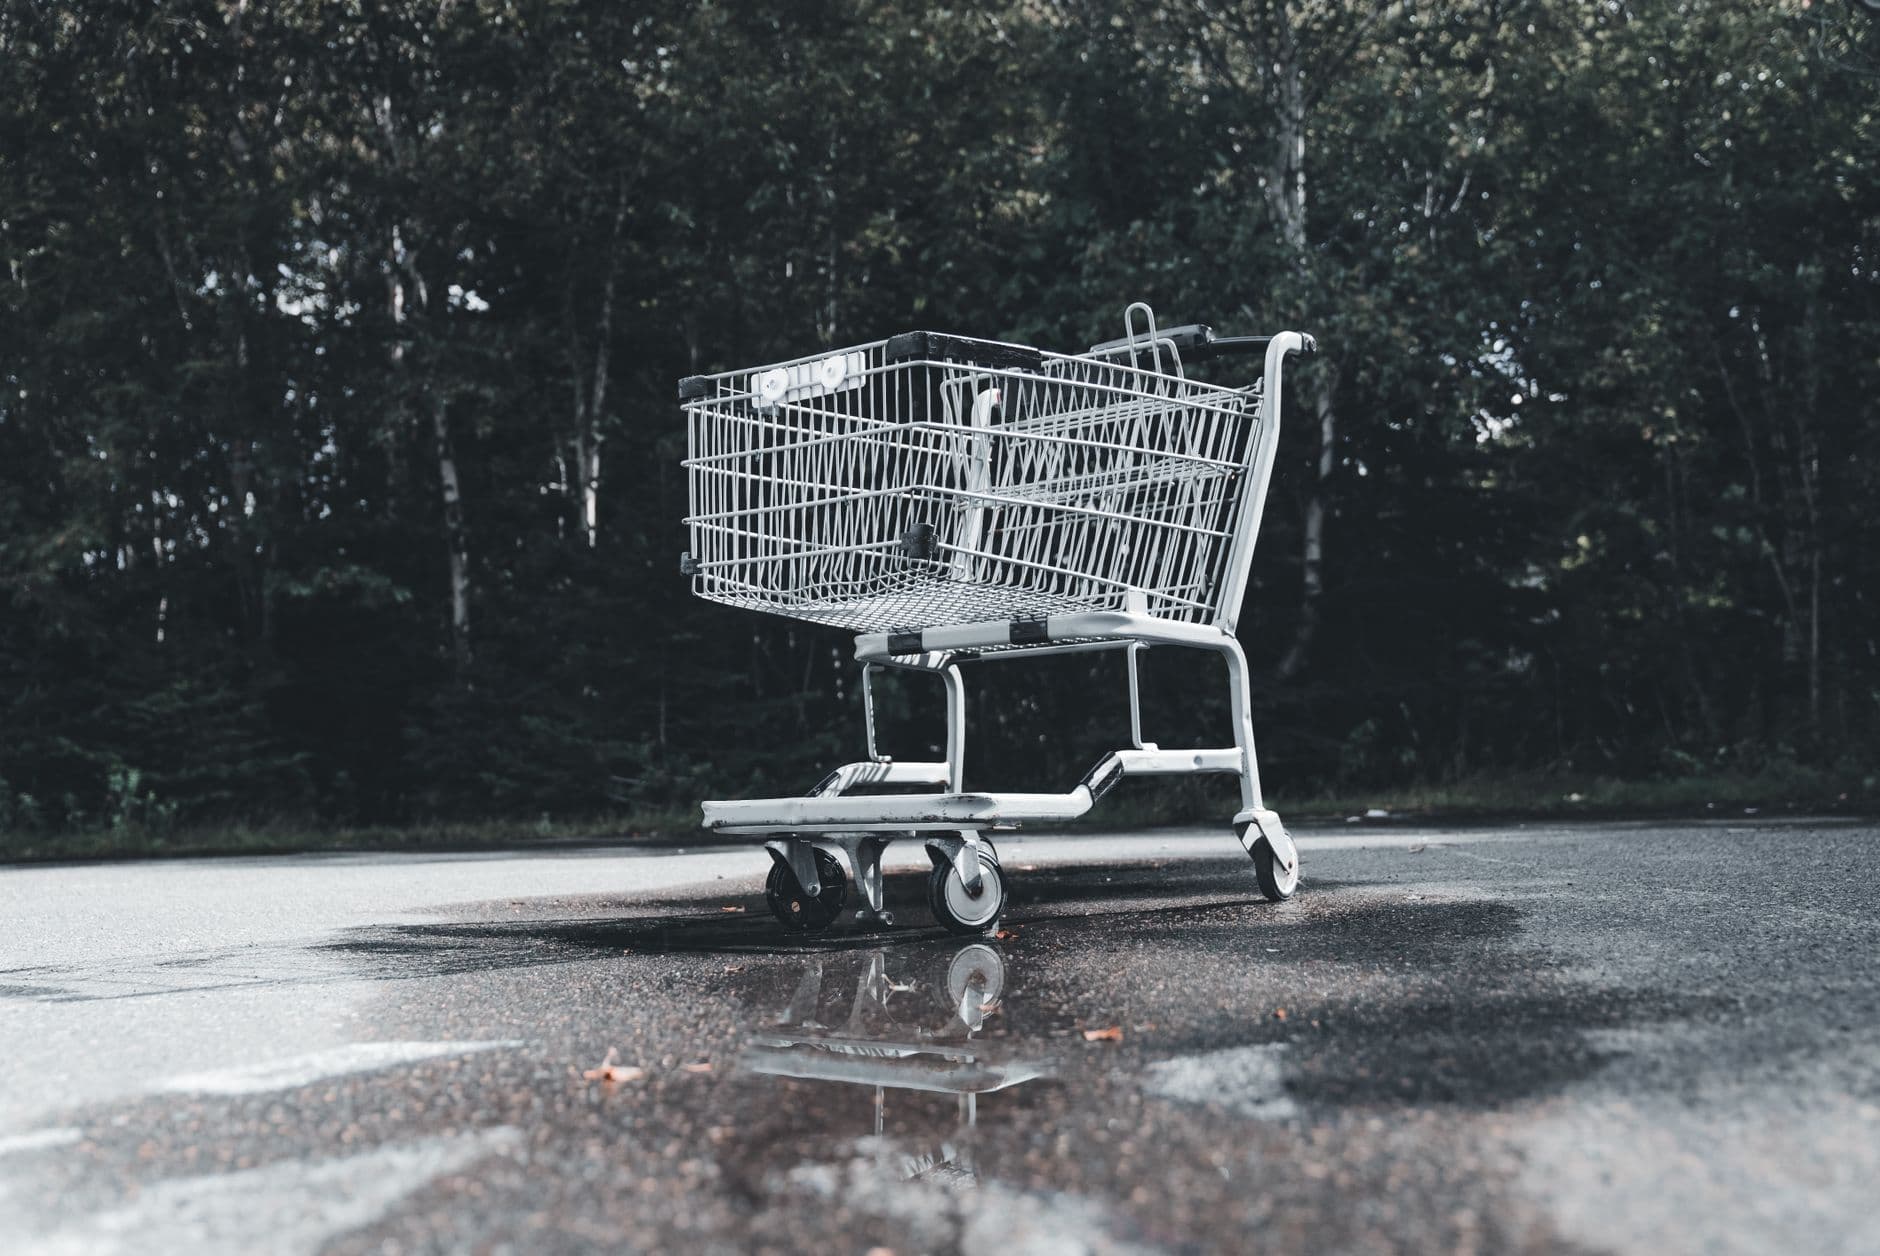
The cart abandonment rate is the percentage of users who add at least one product to the cart but don't complete the purchase. It's one of the most critical metrics in ecommerce because it represents revenue lost at the last stretch of the funnel, when the user has already shown clear purchase intent.
The formula is simple:
Abandonment rate = 1 − (Completed purchases / Initiated carts) × 100
If out of 1,000 users who start a cart only 250 complete the purchase, the abandonment rate is 75%.
The economic impact is enormous. According to Baymard Institute, the global volume of revenue lost to cart abandonment in ecommerce exceeds $4 trillion annually. Approximately 35% of that revenue is recoverable with improvements to the checkout process and recovery strategies.
The abandonment rate varies significantly by sector, device, and business model. Knowing your industry benchmark is the first step to determining whether you have a serious problem or are in line with the average.
| Sector | Average abandonment rate |
|---|---|
| Fashion and apparel | 68% |
| Electronics and technology | 74% |
| Home and decor | 71% |
| Beauty and personal care | 67% |
| Travel and tourism | 81% |
| Food and beverages | 57% |
| Sports and fitness | 72% |
| Global average (all sectors) | 70.19% |
Source: Baymard Institute, 2025
The travel sector has the highest rate because users often start booking processes to compare prices without intending to complete them. Food has the lowest because recurring purchases of familiar products generate less friction.
On mobile, the abandonment rate is consistently higher than on desktop: approximately 85% on mobile devices versus 73% on desktop. Mobile checkout is one of the greatest improvement opportunities in ecommerce.
Baymard Institute has been asking users why they abandon carts for over a decade. The results are consistent year after year.
48% of users who abandon their cart do so because the final costs (shipping, taxes, fees) are higher than expected. This is, year after year, the number one cause.
The problem isn't necessarily that the price is high: it's that the user discovers the real cost at the last step, after having invested time in the process. The feeling of deception triggers an immediate resistance.
Solution: show shipping costs as early as possible, ideally on the product page. If shipping is free above a certain amount, communicate it prominently. If there are additional fees, explain them before checkout.
24% of users abandon when forced to create an account before buying. For a user who wants to complete a quick purchase, the registration form is a barrier that adds no immediate value to their goal.
Solution: always offer the option of guest checkout. You can ask them to create an account after the purchase, when they already have a reason (their order history, loyalty program benefits).
17% abandon because the payment process has too many steps or asks for unnecessary information. The general rule is that a checkout shouldn't have more than 4 steps: address, shipping, payment, and confirmation.
Solution: audit your checkout step by step. Remove any field that isn't essential. Group related information. Show a progress indicator. The fewer clicks to confirmation, the better.
18% of users abandon because they don't trust the site to enter their payment details. This is especially prevalent in smaller ecommerce sites or those with less recognized branding.
Solution: display security badges (SSL, PCI DSS) visibly in the checkout. Include logos of recognized payment methods. A testimonial or average rating near the payment button also increases trust.
9% abandon because their preferred payment method isn't available. The proliferation of digital wallets (Apple Pay, Google Pay, regional options) has raised user expectations.
Solution: integrate the most widely used payment methods in your target market. PayPal remains a trust differentiator for more cautious users. Digital wallets are increasingly expected by default.
| Cause | % of abandonments |
|---|---|
| Unexpected extra costs (shipping, fees) | 48% |
| Required to create an account | 24% |
| Slow delivery process | 22% |
| Security concerns | 18% |
| Checkout too long or complex | 17% |
| Can't see total cost before paying | 16% |
| Site had errors or crashed | 13% |
| Unsatisfactory return policy | 12% |
| Preferred payment method not available | 9% |
Source: Baymard Institute. Note: percentages don't add up to 100% because users can indicate multiple causes.
Reducing abandonment at checkout is the first objective. But recovering users who have already abandoned is the second, and it can have an immediate revenue impact.
The cart recovery email is one of the highest-ROI tactics in ecommerce. The average open rate for these emails exceeds 40%, and the conversion rate sits between 5% and 11%.
The optimal sequence is 3 emails:
| Timing | Objective | |
|---|---|---|
| Email 1: Reminder | 1 hour after abandonment | Remind, without pressure |
| Email 2: Urgency | 24 hours after | Create urgency (stock, deadline) |
| Email 3: Incentive | 72 hours after | Offer discount or free shipping |
The first email shouldn't include a discount: if the user recovers the cart without an incentive, you've maximized your margin. The discount is reserved for the third email, when the user has ignored the previous two.
Retargeting ads on Meta Ads or Google Ads that show exactly the products the user added to their cart have significantly higher click and conversion rates than generic ads. Acquisition cost is lower because the user is already in the decision phase.
A pop-up that triggers when the user moves their cursor toward the close tab or address bar can recover between 2% and 4% of users who are about to leave. The message can be a reminder, a return guarantee, or a one-time discount.
If the user is logged in or has identified their email, the cart must persist across sessions. A user who comes back two days later and finds an empty cart has to start from scratch, which significantly reduces the probability of conversion.
To calculate the impact of reducing the abandonment rate, use this formula:
Recoverable revenue = Abandoned carts × % improvement × Average cart value
Real example:
If with checkout improvements and email recovery you manage to reduce the abandonment rate from 75% to 68%, the impact is:
At annual scale: over €357,000 in incremental revenue, without generating more traffic.
This is the logic of conversion optimization applied to checkout: the traffic already exists, the acquisition cost is already paid. Converting that existing traffic better is the highest-ROI path.
To identify exactly what is slowing conversions in your checkout, start with a diagnosis at Scan&Boost.
If you want to implement a systematic optimization program on your purchase funnel, learn about our CRO agency service.
Adrià Vidal, CRO specialist at Boost.
Composable commerce is a modular e-commerce architecture where you pick the best components for each function. Learn what it is, how it differs from the...
Connected TV (CTV) advertising lets you reach streaming audiences with targeted ads. Learn what CTV is, how it works, and how to integrate it into your...
Contentsquare is the leading digital experience analytics platform. Discover its features, how it differs from Hotjar or Clarity, and how to apply it to...

