

experiencia-de-usuario6 min read
UX Research: What It Is and How to Study Users
UX research uncovers what users need and why they behave the way they do. Learn methods, tools, and how to integrate research into your product.
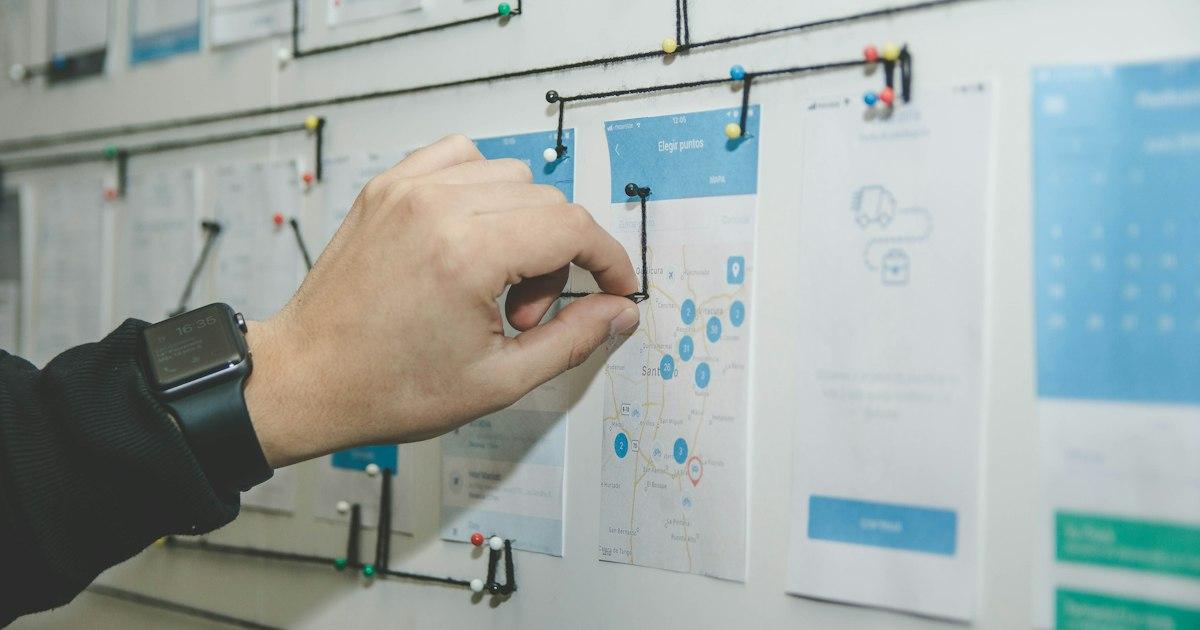
Service design is the discipline that plans and organizes all components of a service — people, processes, technology, spaces — to improve the customer experience and the operational efficiency of the business.
While UX design focuses on the user's interaction with a digital interface (an app, a website, a checkout), service design widens the lens: it includes what happens before, during, and after that interaction. The confirmation email, the support call, the return process, the in-store experience — everything is part of the service.
| Aspect | UX Design | Service Design |
|---|---|---|
| Focus | Digital interface | Full service (digital + physical) |
| Scope | Screens and flows | All customer touchpoints |
| Stakeholders | Product, development | Product, operations, support, logistics |
| Tools | Wireframes, prototypes, tests | Blueprints, journey maps, stakeholder maps |
| Output | Optimized interface | Optimized service system |
The distinction matters: you can have a perfect checkout (UX) and destroy the experience when the package arrives in 15 days with the wrong product (service). Service design connects both worlds.
Everything starts and ends with the customer. Not internal efficiency, not available technology, not how things have always been done. Design decisions must be backed by real user research.
Service design involves all stakeholders: customers, frontline employees, technical teams, management. The customer support agent knows things about user problems that no dashboard can reveal.
A service is a sequence of interrelated actions. Service design maps and optimizes that entire sequence, not just individual moments. Every interaction is connected to the previous one and shapes the next. For a deeper look at this sequence, check our guide on customer journey.
Services are intangible. Service design makes them tangible through physical and digital artifacts the customer can see, touch, or receive: email confirmations, packaging, receipts, notifications.
It considers the full ecosystem: front-stage (what the customer sees), back-stage (what they don't see but still affects them), and the infrastructure supporting everything. A back-stage failure (inventory system down) becomes a front-stage problem (product out of stock without notice).
The service blueprint is the flagship tool of service design. It is a diagram that maps:
| Layer | Example (ecommerce) |
|---|---|
| Customer action | Searches product, compares prices, checks out |
| Front-stage | Website shows stock, chatbot responds, confirmation email |
| Back-stage | Warehouse prepares order, logistics assigns carrier |
| Support | ERP manages inventory, CRM registers the customer |
Maps the customer experience over time, including emotions, expectations, and pain points at each touchpoint. For a practical template, check our article on customer journey map templates.
Visualizes all actors involved in the service and their relationships. Identifies who influences the customer experience and where organizational bottlenecks exist.
Represents the relationships between the service, users, external providers, and channels. Useful for complex services with multiple integrations.
Interviews with customers and employees, support data analysis (tickets, complaints, NPS), observation of real processes. The goal is to understand the current experience without corporate filters.
Create a service blueprint and a journey map of the service as it exists today. Identify pain points, moments of truth (where the customer decides to stay or leave), and opportunities.
Co-creation workshops with stakeholders from different areas. The best solutions usually come from combining perspectives: the support agent who knows what customers ask, the developer who knows what is technically possible, and the user who knows what they need.
Not just the interface — the entire service. Simulate the email flow, response times, the return experience. You can do this with low-fidelity prototypes: customer support scripts, email mockups, process simulations.
Test the new service design with real users, measure the impact on experience metrics (NPS, CSAT, CES) and business metrics (conversion, retention, support cost). Customer journey analytics is fundamental here.
Before: the customer searches for the return policy in the footer, sends an email, waits 48 hours for a response, prints a label, goes to the post office, waits 15 days for a refund.
After service design: the customer goes to "My Orders," selects the product to return, chooses a reason, generates a QR label in the app, drops the package at a nearby pickup point, and receives a refund within 48 hours.
The change is not just UX (return screen) but full service: reverse logistics, agreements with pickup points, automated refund processing.
Before: the user signs up, sees an empty dashboard, doesn't know what to do, opens a support ticket.
After service design: guided registration, first-use checklist, sequential tip emails, onboarding session with the product, automated check-in at day 7.
Service design connects product (in-app checklist), marketing (emails), support (session), and customer success (check-in) into a cohesive experience.
| Metric | What it measures | Benchmark |
|---|---|---|
| NPS (Net Promoter Score) | Likelihood to recommend | >50 is excellent |
| CES (Customer Effort Score) | Perceived customer effort | <3 out of 7 is good |
| CSAT (Customer Satisfaction) | Point-in-time satisfaction | >80% is positive |
| Resolution time | Service efficiency | Depends on the industry |
| Cost per contact | Operational efficiency | Should decrease |
Service design is not a one-time project — it is a mindset that connects customer experience with business operations. If your conversion rate plateaus and you have already optimized the interface, the problem is likely in the service.
At Boost we help optimize the full experience, from the interface to the service surrounding it. Get a free site diagnosis with Scan&Boost.
Adrià Vidal — Boost · Conversion Rate Optimization
UX research uncovers what users need and why they behave the way they do. Learn methods, tools, and how to integrate research into your product.