optimizacion-conversion11 min read
Benchmarking: What It Is, Types, and How to Do It
Complete guide to benchmarking: what it is, the 4 main types, a step-by-step process, and how to compare your conversion rates with your industry...
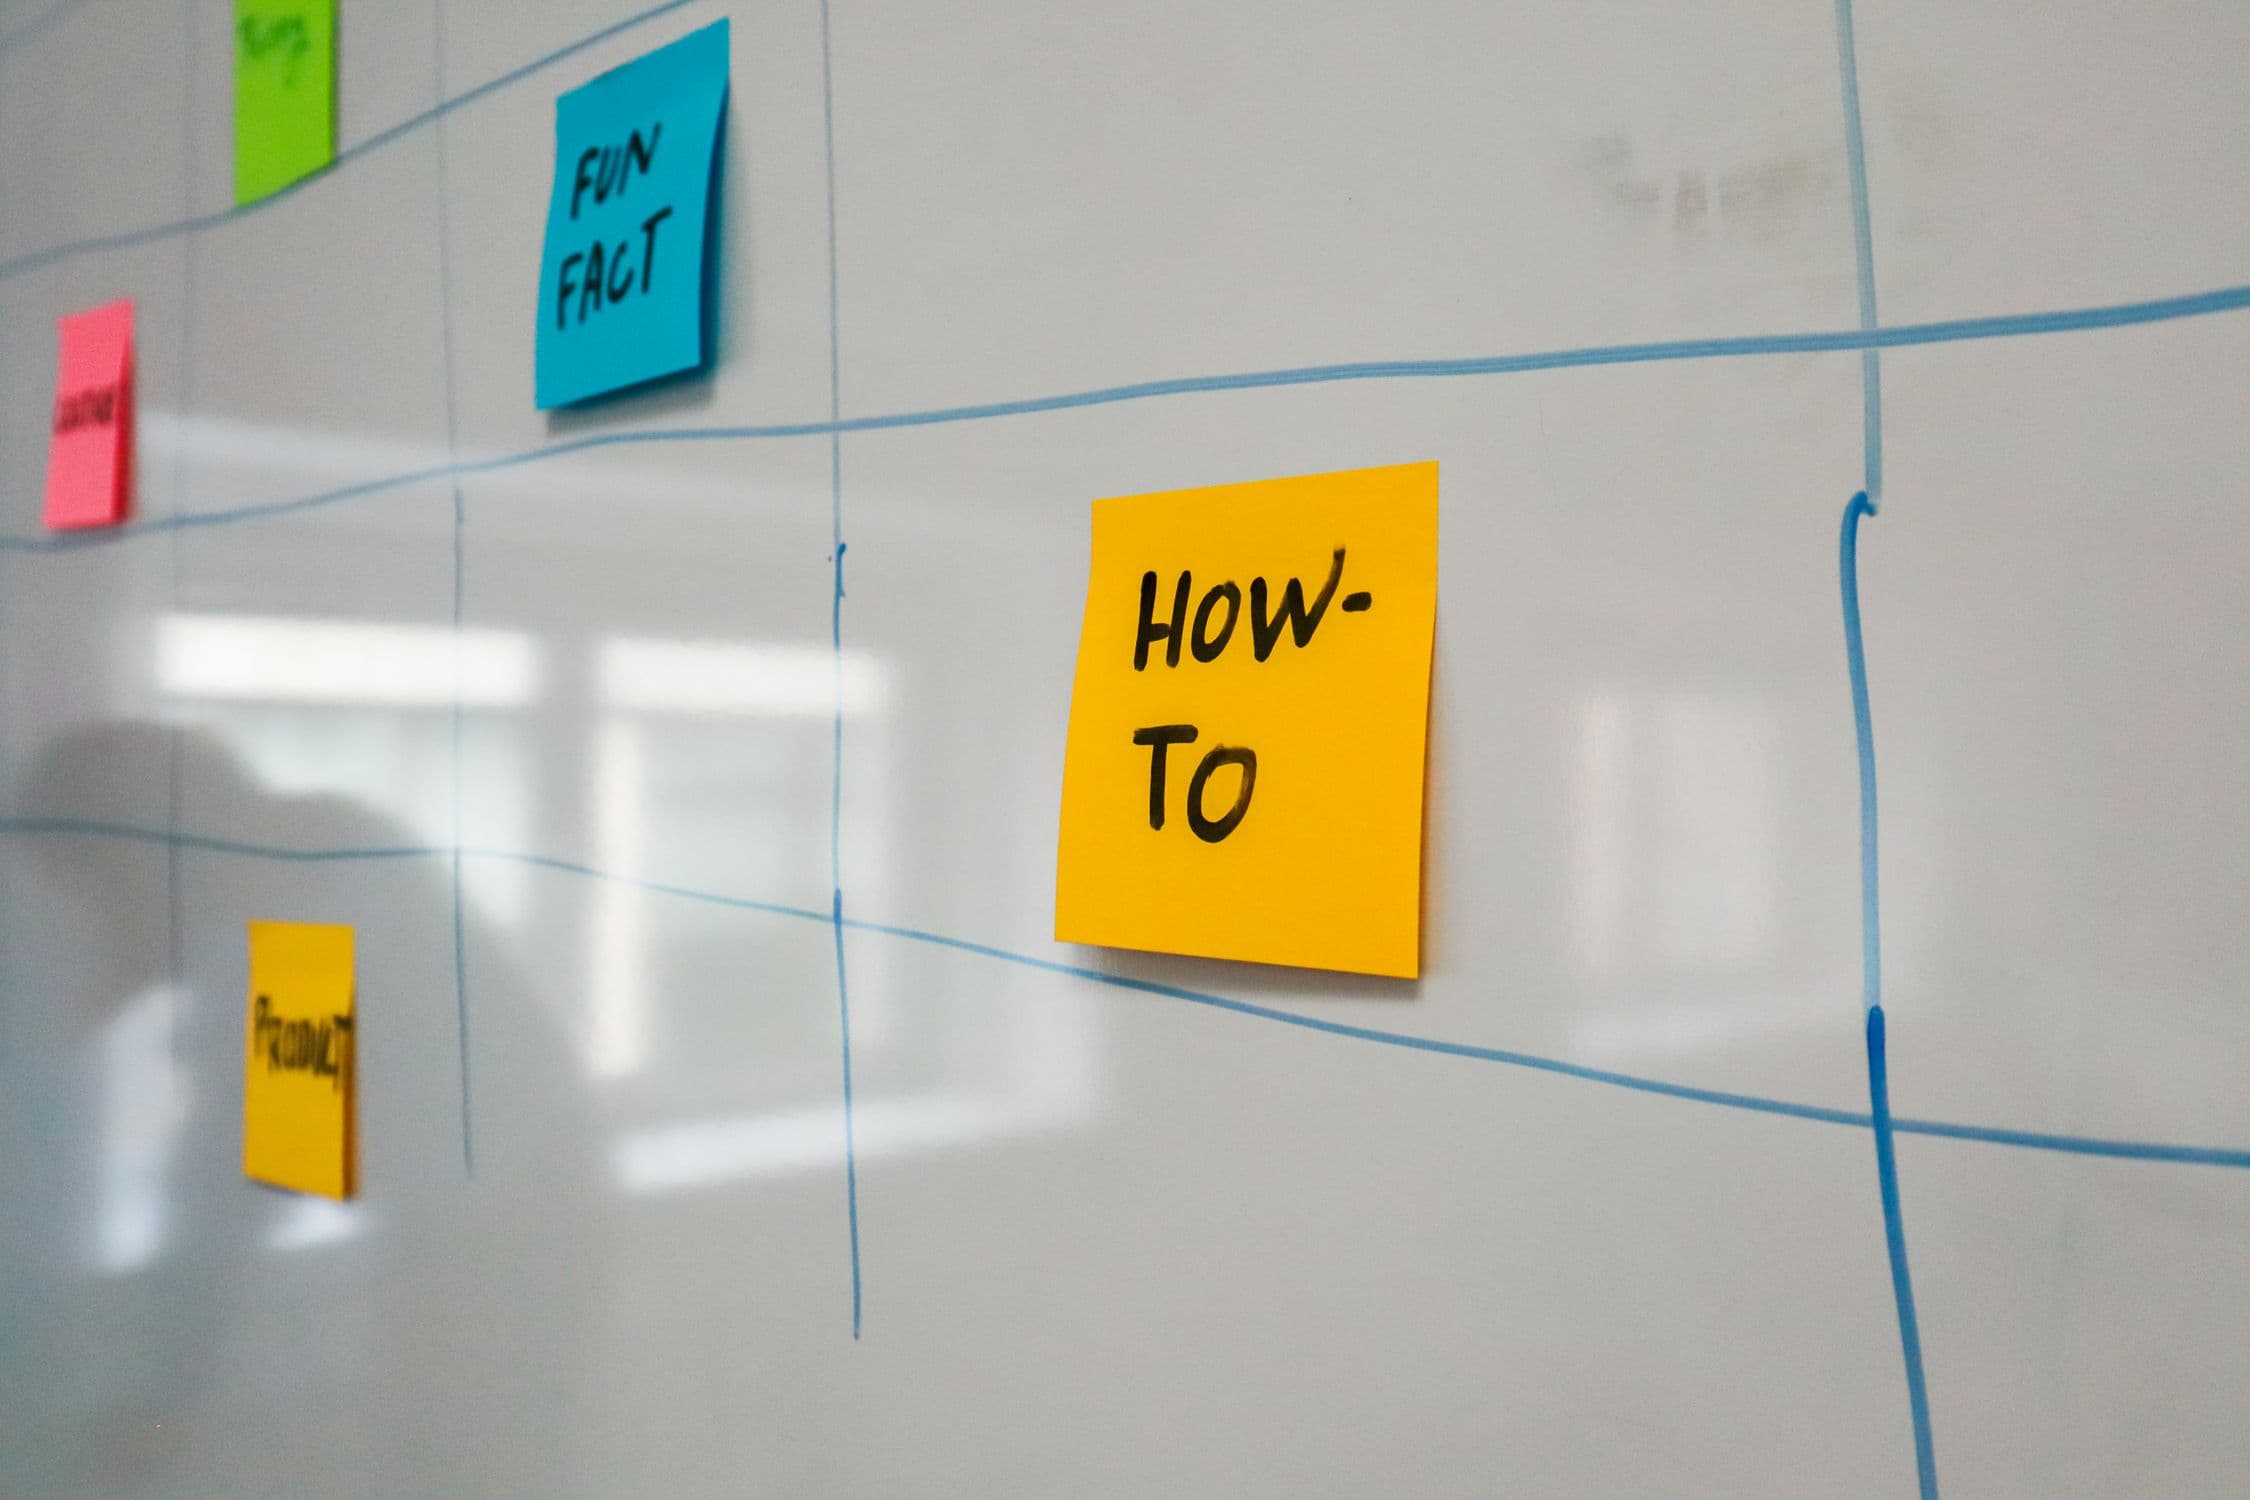
A customer journey map is a visual representation of all the interactions a customer has with your brand, from discovering they have a need to becoming a repeat customer (or dropping off). It's not a decorative diagram — it's a diagnostic tool that reveals where value is lost in the experience.
Without a journey map, optimization decisions are based on assumptions. With one:
A complete map includes these components:
The stages the customer goes through. A common model:
| Phase | What the customer does | Example |
|---|---|---|
| Discovery | Identifies they have a problem or need | Searches Google for "how to improve my website" |
| Consideration | Evaluates options and compares | Reads blog posts, requests demos, compares pricing |
| Decision | Chooses a solution and buys | Hires the service, purchases the product |
| Usage | Uses the product or service | Onboarding, first weeks |
| Loyalty | Repeats, recommends, or leaves | Renews, leaves a review, cancels |
Each point of contact between the customer and the brand: website visit, email, sales call, social media, technical support, invoice, packaging.
What they do at each touchpoint: search, compare, click, call, complain, buy.
How the customer feels at each moment. Pain points (frustration, confusion, distrust) represent the biggest improvement opportunities.
Where the interaction happens: web, app, email, phone, physical store, social media.
KPIs that measure performance at each phase: bounce rate in discovery, conversion rate in decision, NPS in loyalty.
The journey map is built for a specific type of customer. If you have multiple profiles, create a separate map for each. A generic map for "all customers" is useless.
Don't assume. Use real data sources:
Place the journey phases on a timeline. Under each phase, list the touchpoints, customer actions, and associated emotions.
Look for moments where:
Don't try to fix everything at once. Use a framework like ICE (Impact, Confidence, Ease) to prioritize which friction points to address first.
You can create your first journey map in a spreadsheet with this structure:
| Phase | Touchpoint | Customer action | Emotion | Channel | Metric | Opportunity |
|---|---|---|---|---|---|---|
| Discovery | Google search | Searches "CRO agency" | Curiosity | Web | Organic CTR | Improve meta descriptions |
| Consideration | Services page | Compares pricing and cases | Doubt | Web | Time on page | Add testimonials |
| Decision | Contact form | Requests a quote | Anticipation | Web | Submission rate | Simplify fields |
| Usage | Onboarding call | First meeting | Relief | Video call | Post-call CSAT | Send written summary |
| Loyalty | Monthly email | Reads results report | Satisfaction | Open rate | Personalize content |
A customer journey map isn't a pretty deliverable for a presentation. It's a working tool that connects behavioral data with business decisions. Building it with real data, keeping it updated, and using it to prioritize improvements is what separates companies that optimize the experience from those that only talk about it.
At Boost we help companies convert more with data. If you want to map your customers' journey, try our free Scan&Boost.
Complete guide to benchmarking: what it is, the 4 main types, a step-by-step process, and how to compare your conversion rates with your industry...
The Facebook Ad Library lets you view all active ads from any advertiser. Learn how to use it to analyze competitors and improve your campaigns.
A CRO audit reveals exactly why your website is losing conversions. Follow this step-by-step checklist to find and fix the leaks in your funnel.